2024 Budget Explorer
3-Year Historical Summary
See budgeted expenses and estimated revenues in the 2024 budget compared to 2022 actuals, 2023 budget, and 2023 year-end projections. Projections are provided down to the department level of detail only, meaning these graphs cannot be used to compare amounts at the expense type or line item level. To explore data at that level, see "Details & Trends" below.
Details and Trends
All County Funds Details
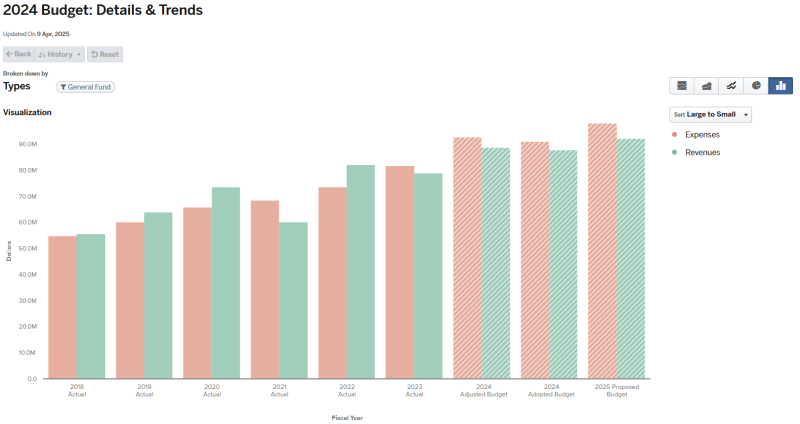
Compare the 2024 budget to the 2023 budget and the last four years (2019-2022) of actuals and drill down to any level of detail, including the individual line item.

| 2018 Actual | 2019 Actual | 2020 Actual | 2021 Actual | 2022 Actual | 2023 Actual | 2024 Adjusted Budget | 2024 Adopted Budget | 2025 Proposed Budget | |
|---|---|---|---|---|---|---|---|---|---|
| Revenues | $ 161,609,149 | $ 177,356,904 | $ 198,480,307 | $ 186,627,882 | $ 235,872,251 | $ 215,034,250 | $ 241,835,485 | $ 240,724,243 | $ 244,753,361 |
| Taxes | 68,251,446 | 72,926,505 | 69,250,344 | 86,816,931 | 94,776,940 | 96,071,358 | 99,533,711 | 99,533,711 | 105,403,457 |
| Intergovernmental | 59,462,571 | 61,613,418 | 65,452,384 | 63,370,687 | 89,593,319 | 75,001,963 | 89,801,394 | 89,511,390 | 74,631,065 |
| User Charges & Fees | 31,935,315 | 34,765,222 | 36,587,263 | 39,460,170 | 38,202,741 | 37,173,563 | 41,736,588 | 41,641,981 | 42,627,564 |
| Transfers | 2,499,090 | 3,257,520 | 5,781,551 | 5,257,546 | 8,643,543 | 4,096,623 | 3,610,539 | 3,610,539 | 14,371,485 |
| Other Sources | -1,477,885 | 3,489,996 | 20,114,381 | -8,339,682 | 6,563,824 | -3,088,033 | 6,115,953 | 5,389,322 | 4,913,230 |
| Interest | 938,613 | 1,304,243 | 1,294,384 | 62,230 | -1,908,116 | 5,778,776 | 1,037,300 | 1,037,300 | 2,806,560 |
| Expenses | 158,909,367 | 159,305,514 | 180,300,456 | 180,225,925 | 219,650,560 | 221,088,499 | 267,352,343 | 261,056,944 | 272,718,093 |
| Personnel | 74,766,682 | 80,679,410 | 83,200,547 | 87,434,479 | 94,516,183 | 103,243,373 | 111,627,539 | 111,922,016 | 120,377,122 |
| Operating | 31,888,506 | 34,970,591 | 36,686,195 | 41,215,910 | 43,820,291 | 46,494,566 | 52,762,616 | 51,745,284 | 52,529,051 |
| Capital | 27,618,707 | 18,707,345 | 21,209,611 | 25,555,938 | 28,585,181 | 37,569,266 | 69,792,283 | 65,015,441 | 47,772,418 |
| Other | 17,616,535 | 19,987,730 | 20,323,607 | 19,500,044 | 42,122,241 | 26,683,995 | 27,587,066 | 26,791,364 | 24,005,971 |
| Transfers | 5,323,090 | 3,277,520 | 5,801,551 | 5,294,046 | 9,119,510 | 5,241,322 | 4,360,239 | 4,360,239 | 26,246,336 |
| Debt Service | 1,695,847 | 1,682,918 | 13,078,946 | 1,225,507 | 1,487,155 | 1,855,977 | 1,222,600 | 1,222,600 | 1,787,195 |
| Revenues Less Expenses | $ 2,699,782 | $ 18,051,390 | $ 18,179,852 | $ 6,401,957 | $ 16,221,691 | $ -6,054,250 | $ -25,516,858 | $ -20,332,701 | $ -27,964,732 |
General Fund Details
| 2018 Actual | 2019 Actual | 2020 Actual | 2021 Actual | 2022 Actual | 2023 Actual | 2024 Adjusted Budget | 2024 Adopted Budget | 2025 Proposed Budget | |
|---|---|---|---|---|---|---|---|---|---|
| Revenues | $ 55,782,370 | $ 64,043,982 | $ 73,672,302 | $ 60,185,452 | $ 82,223,389 | $ 79,006,883 | $ 88,892,978 | $ 87,960,948 | $ 92,328,049 |
| Taxes | 34,003,841 | 35,502,999 | 30,876,972 | 42,004,896 | 45,582,813 | 46,522,206 | 48,514,091 | 48,514,091 | 51,787,454 |
| Intergovernmental | 14,189,986 | 14,951,206 | 24,079,256 | 17,450,572 | 21,247,381 | 24,019,074 | 25,138,970 | 25,028,178 | 24,812,428 |
| User Charges & Fees | 9,641,269 | 10,564,153 | 10,427,010 | 11,343,012 | 10,946,421 | 9,927,552 | 10,146,742 | 10,052,135 | 10,166,493 |
| Transfers | 628,745 | 645,500 | 740,400 | 675,000 | 5,107,938 | 715,000 | 1,082,585 | 1,082,585 | 1,072,500 |
| Interest | 838,350 | 1,176,144 | 1,189,518 | 40,504 | -2,190,604 | 4,927,090 | 1,000,000 | 1,000,000 | 2,500,000 |
| Other Sources | -3,519,820 | 1,203,979 | 6,359,145 | -11,328,531 | 1,529,441 | -7,104,039 | 3,010,590 | 2,283,959 | 1,989,174 |
| Expenses | 54,922,436 | 60,152,002 | 65,982,872 | 68,646,346 | 73,776,852 | 81,800,198 | 92,791,218 | 91,115,018 | 97,948,032 |
| Personnel | 34,460,083 | 36,514,852 | 39,017,199 | 42,131,301 | 45,867,451 | 51,085,726 | 57,592,532 | 57,634,018 | 62,698,101 |
| Operating | 17,761,949 | 19,788,636 | 20,551,532 | 21,139,999 | 22,795,257 | 25,323,345 | 29,754,130 | 28,940,925 | 29,890,983 |
| Other | 1,814,952 | 1,978,498 | 1,793,053 | 2,264,409 | 2,087,666 | 2,358,878 | 3,845,983 | 3,050,281 | 2,299,281 |
| Transfers | 438,539 | 1,180,570 | 3,488,359 | 2,785,464 | 2,282,805 | 1,951,677 | 1,120,596 | 1,120,596 | 2,795,720 |
| Capital | 446,913 | 689,446 | 1,132,729 | 325,173 | 640,395 | 873,500 | 477,977 | 369,198 | 263,947 |
| Debt Service | 0 | 0 | 0 | 0 | 103,279 | 207,072 | 0 | 0 | 0 |
| Revenues Less Expenses | $ 859,934 | $ 3,891,979 | $ 7,689,430 | $ -8,460,894 | $ 8,446,537 | $ -2,793,315 | $ -3,898,240 | $ -3,154,070 | $ -5,619,983 |
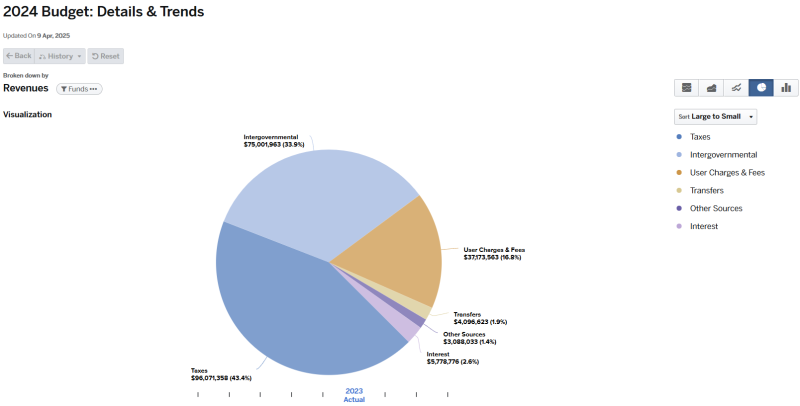
Sources of Funds
| 2018 Actual | 2019 Actual | 2020 Actual | 2021 Actual | 2022 Actual | 2023 Actual | 2024 Adjusted Budget | 2024 Adopted Budget | 2025 Proposed Budget | |
|---|---|---|---|---|---|---|---|---|---|
| Taxes | $ 68,251,446 | $ 72,926,505 | $ 69,250,344 | $ 86,816,931 | $ 94,776,940 | $ 96,071,358 | $ 99,533,711 | $ 99,533,711 | $ 105,403,457 |
| Sales Taxes | 39,152,741 | 42,640,930 | 44,897,594 | 54,604,717 | 60,231,588 | 60,691,567 | 61,577,020 | 61,577,020 | 64,356,451 |
| Property Taxes | 22,429,779 | 23,333,044 | 18,357,836 | 25,087,359 | 27,543,935 | 28,034,473 | 30,613,096 | 30,613,096 | 33,153,411 |
| Use Taxes | 3,325,456 | 3,482,101 | 3,236,945 | 3,514,273 | 3,490,433 | 3,601,716 | 3,943,595 | 3,943,595 | 3,993,595 |
| Specific Ownership Taxes | 3,343,470 | 3,470,431 | 2,757,968 | 3,610,581 | 3,510,984 | 3,743,602 | 3,400,000 | 3,400,000 | 3,900,000 |
| Intergovernmental | 59,462,571 | 61,613,418 | 65,452,384 | 63,370,687 | 89,593,319 | 75,001,963 | 89,801,394 | 89,511,390 | 74,631,065 |
| Federal Funds | 24,942,874 | 26,836,039 | 34,619,113 | 31,021,695 | 57,039,527 | 38,669,445 | 43,223,287 | 43,223,286 | 35,459,838 |
| State Funds | 34,151,102 | 34,196,093 | 30,132,023 | 31,152,377 | 31,744,339 | 34,661,079 | 45,387,358 | 45,097,355 | 38,117,934 |
| Other Intergovernmental | 368,596 | 581,287 | 701,248 | 1,196,615 | 809,453 | 1,671,439 | 1,190,749 | 1,190,749 | 1,053,293 |
| User Charges & Fees | 31,935,315 | 34,765,222 | 36,587,263 | 39,460,170 | 38,202,741 | 37,173,563 | 41,736,588 | 41,641,981 | 42,627,564 |
| Interdepartmental Charges | 15,106,485 | 17,038,256 | 18,986,824 | 20,957,002 | 20,048,005 | 20,836,755 | 23,713,875 | 23,713,875 | 25,533,623 |
| Charges for Services | 10,193,202 | 10,422,048 | 9,810,767 | 10,110,697 | 10,035,822 | 9,072,434 | 10,583,364 | 10,574,284 | 9,766,342 |
| Fee Accounts | 4,281,312 | 4,836,662 | 5,272,641 | 5,410,921 | 4,806,113 | 4,477,939 | 4,632,236 | 4,632,236 | 4,532,236 |
| Licenses & Permits | 2,354,316 | 2,468,255 | 2,517,031 | 2,981,549 | 3,312,801 | 2,786,434 | 2,807,113 | 2,721,586 | 2,795,363 |
| Transfers | 2,499,090 | 3,257,520 | 5,781,551 | 5,257,546 | 8,643,543 | 4,096,623 | 3,610,539 | 3,610,539 | 14,371,485 |
| Other Sources | -1,477,885 | 3,489,996 | 20,114,381 | -8,339,682 | 6,563,824 | -3,088,033 | 6,115,953 | 5,389,322 | 4,913,230 |
| Miscellaneous Revenue | 3,259,933 | 3,176,984 | 14,759,425 | 4,073,135 | 5,839,066 | 6,961,798 | 5,081,028 | 4,354,397 | 4,565,355 |
| Fines & Forfeitures | 270,360 | 313,012 | 261,240 | 281,291 | 327,932 | 349,345 | 321,375 | 321,375 | 347,875 |
| Other Financing Sources | 0 | 0 | 0 | 0 | 1,110,376 | 1,093,094 | 0 | 0 | 0 |
| TABOR Refund | -5,008,178 | 0 | 5,093,716 | -12,694,108 | -713,550 | -11,492,270 | 713,550 | 713,550 | 0 |
| Interest | 938,613 | 1,304,243 | 1,294,384 | 62,230 | -1,908,116 | 5,778,776 | 1,037,300 | 1,037,300 | 2,806,560 |
| Total | $ 161,609,149 | $ 177,356,904 | $ 198,480,307 | $ 186,627,882 | $ 235,872,251 | $ 215,034,250 | $ 241,835,485 | $ 240,724,243 | $ 244,753,361 |
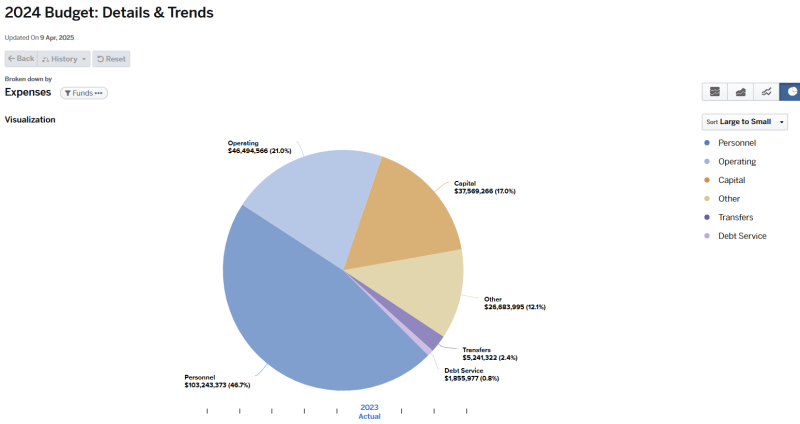
Uses of Funds
| 2018 Actual | 2019 Actual | 2020 Actual | 2021 Actual | 2022 Actual | 2023 Actual | 2024 Adjusted Budget | 2024 Adopted Budget | 2025 Proposed Budget | |
|---|---|---|---|---|---|---|---|---|---|
| Personnel | $ 74,766,682 | $ 80,679,410 | $ 83,200,547 | $ 87,434,479 | $ 94,516,183 | $ 103,243,373 | $ 111,627,539 | $ 111,922,016 | $ 120,377,122 |
| Operating | 31,888,506 | 34,970,591 | 36,686,195 | 41,215,910 | 43,820,291 | 46,494,566 | 52,762,616 | 51,745,284 | 52,529,051 |
| Capital | 27,618,707 | 18,707,345 | 21,209,611 | 25,555,938 | 28,585,181 | 37,569,266 | 69,792,283 | 65,015,441 | 47,772,418 |
| Other | 17,616,535 | 19,987,730 | 20,323,607 | 19,500,044 | 42,122,241 | 26,683,995 | 27,587,066 | 26,791,364 | 24,005,971 |
| Transfers | 5,323,090 | 3,277,520 | 5,801,551 | 5,294,046 | 9,119,510 | 5,241,322 | 4,360,239 | 4,360,239 | 26,246,336 |
| Debt Service | 1,695,847 | 1,682,918 | 13,078,946 | 1,225,507 | 1,487,155 | 1,855,977 | 1,222,600 | 1,222,600 | 1,787,195 |
| Total | $ 158,909,367 | $ 159,305,514 | $ 180,300,456 | $ 180,225,925 | $ 219,650,560 | $ 221,088,499 | $ 267,352,343 | $ 261,056,944 | $ 272,718,093 |
Staffing
View the total number of full-time positions by department, compare staffing levels over time, and learn more about the 14 new positions approved in the 2024 budget.
Authorized Staffing Level, 2021-2023
| Department | 2021 Final | 2022 Amended | 2023 Adopted |
|---|---|---|---|
| Employees: Total | 1109.65 | 1140.9 | 1204.9 |
| Information Technology | 21 | 26 | 26 |
| Internal Services | 2 | 2 | 2 |
| Animal Services | 13 | 13 | 13 |
| Public Works: Engineering | 18 | 17 | 18 |
| Clerk & Recorder | 35 | 35 | 35 |
| Treasurer | 7 | 7 | 7 |
| Community Development | 31 | 34 | 34 |
| Assessor | 25.5 | 25.5 | 25.5 |
| Sheriff | 255 | 259.5 | 270.5 |
| Fairgrounds | 4 | 4 | 4 |
| Regional Transportation Planning Office | 6 | 6 | 6 |
| Public Works: Traffic | 8 | 8 | 8 |
| Public Works: Rural Community Services | 1 | 1 | 1 |
| Public Works: Administration | 3 | 3 | 3 |
| Facilities & Parks | 17 | 20 | 39 |
| District Attorney | 69 | 74 | 76 |
| Human Services | 282.5 | 295.5 | 312.5 |
| Coroner | 4 | 6 | 6 |
| Public Works: Road & Bridge | 51 | 51 | 51 |
| Human Resources | 7 | 8 | 9 |
| Public Health | 90.05 | 88.05 | 91.05 |
| County Attorney | 18 | 19 | 19 |
| County Administration | 7 | 9 | 17 |
| Risk Management | 1 | 1 | 1 |
| Board of County Commissioners | 3 | 3 | 3 |
| Fleet Management | 14 | 12 | 12 |
| Public Works: Noxious Weed & Pest Management | 1 | 1 | 1 |
| Finance | 7 | 7 | 9 |
| Criminal Justice Services | 84 | 73.75 | 73.75 |
| Surveyor | 1 | 1 | 1 |
| Purchasing | 1 | 1 | 1 |
| Solid Waste Management | 21.6 | 27.6 | 27.6 |
| Public Works: Stormwater | 1 | 2 | 2 |